The Visualizer from NUGEN Audio is a spectrum analyzer plug-in that is designed for use in a multitude of recording, mixing, and mastering situations. It is compatible with Mac and Windows and works standalone or with use of a host program that supports VST or AU plug-ins.
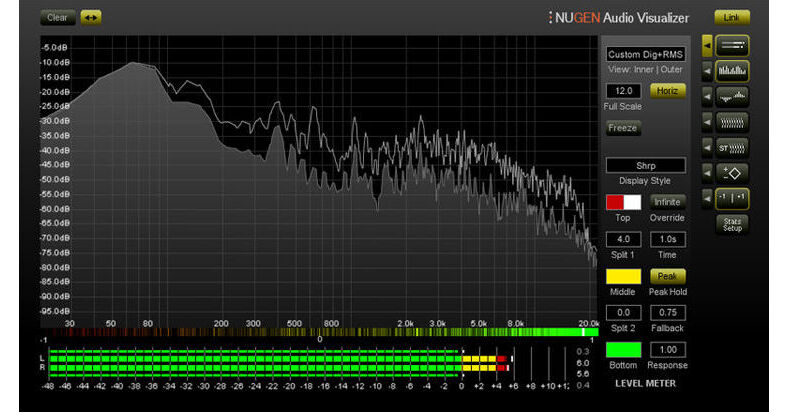
The Visualizer is an audio analysis tool that can help you identify problematic frequencies, fundamentals, harmonics, and much more. It has several visual displays including a traditional spectrum analysis display, a spectrogram display that shows level and frequency history with a zoom control, and primary and secondary meter displays, which allow for multiple metering types to be viewed simultaneously. Some of the different metering types include standard peak and RMS metering, K-system meters, and a stereo margin indicator that displays dB remaining until clip.
The Visualizer is designed to be helpful in a wide variety of use cases. The software features a -20 dBFS RMS pink-noise signal generator that can be used for acoustical testing purposes. It can be used to aid in room tuning, for analyzing the acoustical properties of acoustic spaces such as control rooms, live rooms, and auditoriums. Use Visualizer in recording situations for helping to determine mic placements or for EQing. Use it in mixing and mastering for investigating hard-to-hear low-frequency issues, honing in on problem areas, examining phase relationships, peak monitoring, and more.